



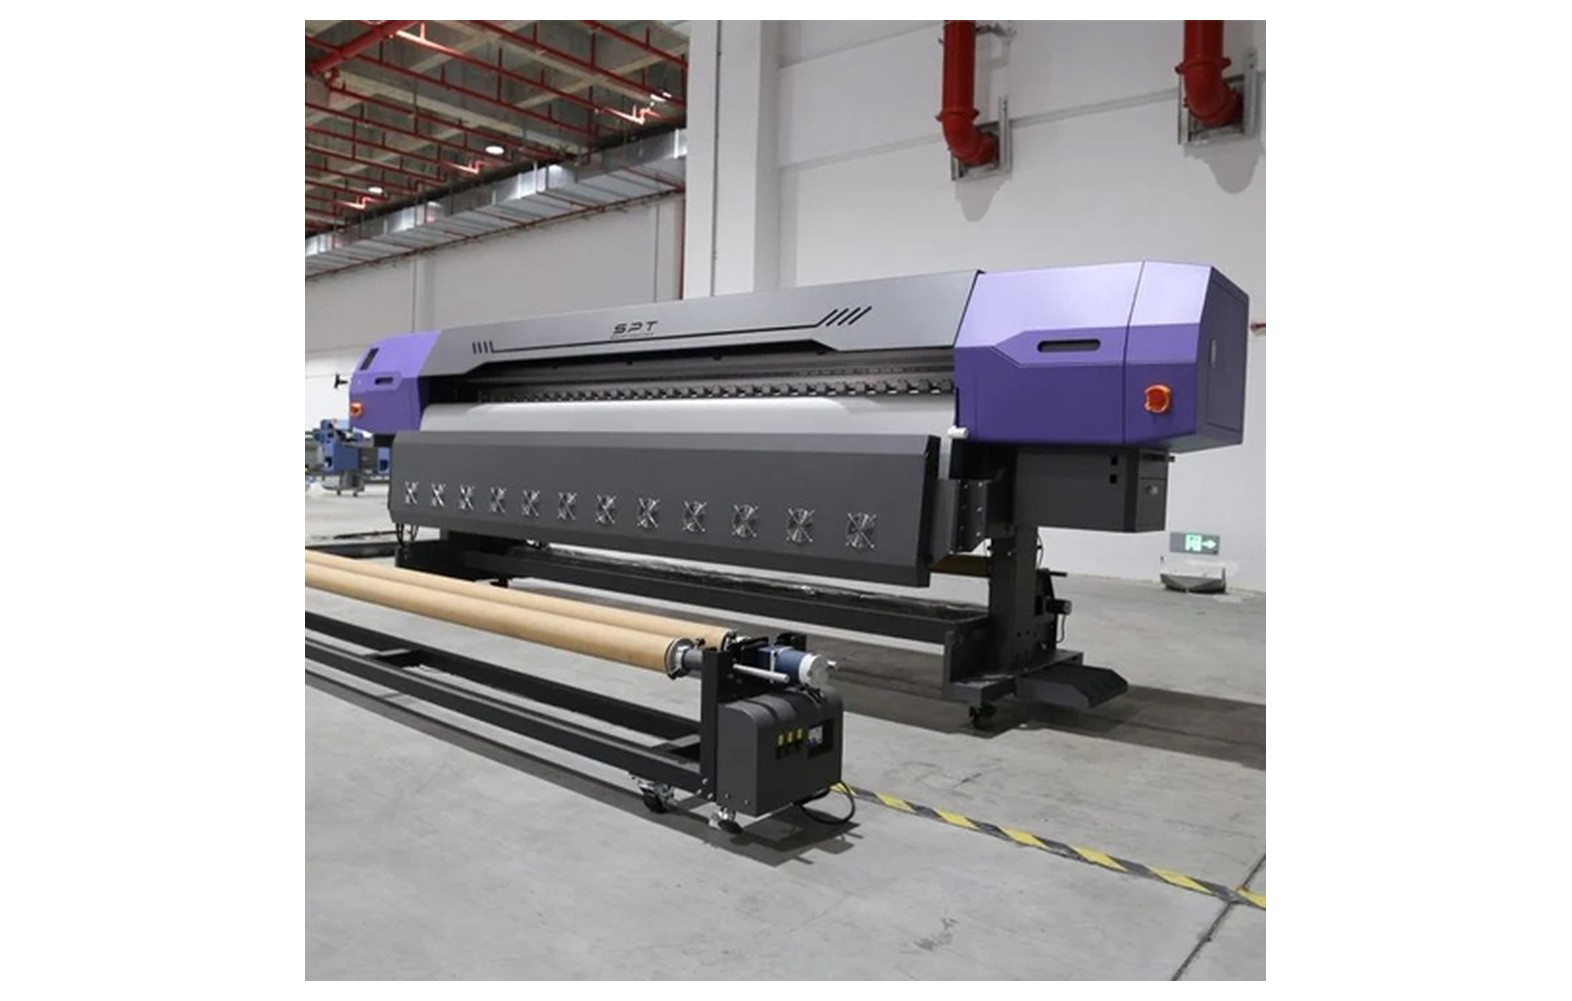
Direct answer: Estimate capacity from measured output at an acceptable print-quality setting, then account for the actual time available, setup, maintenance, reprints and the finishing workflow. A brochure’s maximum square feet per hour is not the same as saleable production. Use your own job mix and test data, and state every assumption in the calculation.
What production capacity means
Capacity is the amount of accepted work a production system can deliver in a defined period under stated conditions. For a wide-format printer, the system includes artwork preparation, media loading, printing, inspection, finishing, packing and dispatch. The limiting step may not be the printer itself.
First decide what you are measuring: gross printed area, accepted area, finished banners, panels or orders delivered. These measures are related but not interchangeable. A shop can print a large area while producing fewer accepted finished pieces if there are defects, changeovers or a finishing backlog.
State the time period and scope. A machine-hour rate excludes tasks performed before or after the machine run unless explicitly included. A shift or monthly estimate should account for the time those tasks occupy and the availability of people and equipment. Avoid comparing a vendor’s theoretical print rate with a shop’s finished-job rate as if they measured the same thing.
Confirm the actual machine width
Sixteen feet is approximately 4.88 metres; five metres is approximately 16.4 feet. A printer advertised in either category can have its own maximum media width, printable width and edge margins. Use the actual model’s usable print width in a capacity estimate, not its marketing label.
The usable printed area may also differ from finished saleable area because of margins, trim, overlap, hems or unusable sections between jobs. A wide roll can carry multiple smaller jobs if the RIP, media and workflow allow it, but nesting is not always perfect. Track actual material use and accepted finished output separately.
Check the machine’s approved media width, roll diameter and weight. A theoretical rate is irrelevant if the selected roll cannot be loaded, tracked or taken up safely. The manufacturer’s specification and a representative demonstration should form the starting point.
Why advertised speed can mislead
A maximum speed may be measured at a particular resolution, pass count, coverage, material and operating condition. It may not deliver the appearance your customer requires. Ask the supplier to identify those conditions and demonstrate the actual machine on representative artwork and stock at the quality mode you intend to sell.
Output can change with pass count, image coverage, colour profile, media advance, print direction and machine configuration. The number of heads or the print width alone does not establish a reliable production rate. Different jobs can also require different quality and drying or handling procedures.
Measure elapsed time for a representative length after the machine is printing steadily, and record the settings and conditions. Then measure setup and changeovers separately. A single short demonstration is only a starting sample; repeat observations across typical jobs and operators before treating the rate as a planning assumption.
Measure gross printing rate
One approach is to measure printed area during a timed run and divide by elapsed printing time. For example, if a hypothetical accepted-quality test prints 400 square feet in 2 hours of machine printing, the observed gross rate is 200 square feet per printing hour. This is an invented example, not a performance claim for any printer.
Record the artwork, actual printed width and length, media, ink, profile, pass count, resolution, machine configuration and any interruptions. Decide whether the elapsed time includes loading, cleaning and job changes. If those activities are excluded from the timed run, subtract their time later in the shift calculation; do not count the same delay twice.
Inspect the test output against the agreed quality criteria. If the mode produces unacceptable banding or colour, its area should not be used as a saleable-output rate. Re-test at a suitable mode and retain the sample and measurement record.
Calculate available printing time
Start with the planned shift length. Subtract breaks and the time during which the printer cannot produce the planned job because of startup, loading, changeovers, routine maintenance or other scheduled activities. Include unplanned downtime only if it is estimated from a defined assumption or historical records. Be clear whether tasks occur during or outside the shift.
For a hypothetical eight-hour shift, suppose breaks and non-printing activities occupy two hours. The available printing time is six hours. If the measured gross printing rate is 200 square feet per hour, the illustrative gross printed area is 1,200 square feet before any print-quality loss. These values are invented to explain the method, not expected output for a 16 ft machine.
Do not subtract time for an activity already included in the measured print rate. For example, if a measured end-to-end rate includes loading and cleaning, subtracting the same loading and cleaning again would understate capacity. Write down the boundary of each measurement and check the arithmetic with the production team.
Convert gross area to accepted output
Some printed area may be rejected due to defects, wrong data, colour mismatch or damage. Estimate an acceptance rate from actual comparable jobs when possible. Accepted printed area equals gross printed area multiplied by the proportion accepted, provided the loss rate is defined consistently and has not already been included in the measurement.
Continuing the hypothetical example, if 95 percent of 1,200 square feet is accepted, accepted printed area is 1,140 square feet. The 5 percent loss is an illustrative assumption, not an industry benchmark. It should include only the losses specified in the model and should be replaced with the shop’s own measured results.
Accepted printed area still may not equal finished saleable area. Trim, hems, panel overlap and nesting gaps can consume material without becoming visible finished graphic. If the job is sold by finished area, calculate the finished area from the approved dimensions and quantity rather than treating all inked or fed material as billable.
Understand the finishing constraint
Trimming, joining, reinforcement, eyelets, inspection and packing may take longer than printing for some orders. If one finishing team can complete fewer jobs than the printer produces during the same period, finished output is limited by finishing capacity. A queue can accumulate even when the printer has spare capacity.
Measure finishing using representative jobs, including setup and quality checks. A single-piece banner and a panelled hoarding can have very different labour and handling needs. Track the number of accepted finished pieces per shift and the area associated with them. Use the same time period when comparing print and finishing capacities.
For a simplified hypothetical example, if printing can supply 1,140 accepted square feet per shift but finishing can process only 900 square feet of the same job mix, the system’s finished throughput cannot exceed 900 square feet in that shift without additional finishing capacity or a process change. This assumes work is comparable and materials are available; real mixed jobs require a more detailed schedule.
Account for the job mix
A shop rarely prints the same artwork and size all day. Small urgent banners, wide hoarding panels and colour-critical event graphics may require different profiles, media and finishing. Estimate the proportion of each job class and use a measured rate and setup time appropriate to it. Do not apply the fastest mode to every order.
Include the number of job changes, roll changes and proofs. A shift with many short orders can spend more time in setup than one long run, even at the same nominal print speed. Nesting compatible jobs may reduce gaps, but it can also complicate prioritisation or hold an urgent order. Use the actual RIP and workflow to test the layout.
Check whether the finishing team can process the same mix that the printer produces. A square-foot rate may hide the extra time needed for small pieces, multiple seams or special packing. For detailed scheduling, calculate time per job or per panel as well as area.
Plan monthly output without double counting
Once a realistic accepted output per shift is measured, multiply by the number of planned productive shifts. Adjust for holidays, planned service, training or expected closures only if those days were not already excluded from the shift count. Capacity is a planning estimate, not a sales commitment.
For illustration, if a shop estimates 900 square feet of finished output per shift and plans 20 productive shifts, its simple monthly capacity estimate is 18,000 square feet for that specific job mix. The figures are hypothetical and do not represent a guaranteed result. If finishing, demand or staff availability changes, the estimate must be recalculated.
Do not multiply an eight-hour theoretical print rate by every calendar day and then present the result as revenue or profit. Actual orders, prices, labour, waste, maintenance, financing and market conditions determine business outcomes. Capacity is not the same as utilisation or sales.
Capacity, utilisation and demand
Capacity describes what the system could produce under stated assumptions. Utilisation describes how much of that capacity is actually used. Demand is the volume customers order. A printer with unused capacity may still be unable to deliver an urgent job if it arrives alongside other deadlines or if finishing is occupied.
Track confirmed orders separately from enquiries and forecasts. Use low, expected and high demand scenarios when evaluating an investment. Include seasonal variation where relevant without assuming that a peak month repeats all year. A wide machine does not generate orders on its own.
Review the mix of outsourced and in-house work. Outsourcing can provide additional capacity during peaks or maintenance, but its cost, lead time and quality need to be confirmed. Compare the complete delivered job rather than assuming that all work must be printed internally.
A practical measurement worksheet
- Define the output: gross printed area, accepted printed area, finished area or completed jobs.
- Select representative work: identify artwork, media, ink, print mode, dimensions and quality criteria.
- Measure the run: record actual printed area and elapsed printing time, including the boundaries of the measurement.
- Record non-printing time: startup, loading, changeovers, maintenance, breaks and relevant interruptions.
- Inspect output: count rejected area and identify the reason using a consistent definition.
- Measure finishing: track trim, joins, reinforcement, inspection and packing for the same job mix.
- Identify the bottleneck: compare printer and finishing capacity over the same shift.
- Review assumptions: document material availability, staff, productive days and any outsourced work.
Repeat the measurement on different days and jobs. A single best-case run can be useful as a technical reference but should not be the sole basis for a monthly promise. Review the estimate when the machine, media, staff, quality standard or finishing process changes.
Common calculation errors
Using maximum speed as accepted output: measure the actual quality mode and remove rejected work using a defined method.
Double-counting delays: decide whether setup and maintenance are included in the timed rate or subtracted separately, not both.
Ignoring finishing: compare printing and finishing for the same period and job mix. The slowest relevant step can limit delivery.
Confusing printed and finished area: account for trim, overlap, hems and gaps. Use the customer’s approved finished dimensions for finished-area calculations.
Assuming full utilisation: confirmed orders, staff, media and deadlines determine actual production. Capacity alone does not guarantee demand.
Applying one rate to every job: different quality modes, media and changeovers require different assumptions.
Improve capacity without compromising quality or safety
Begin with the bottleneck identified by measurement. If frequent file errors delay setup, improve artwork preflight and customer approval. If roll changes consume time, plan compatible work together where deadlines and material requirements permit. If finishing is the constraint, evaluate the finishing process and staffing before buying another printer.
Maintain the printer according to the manufacturer’s instructions and train operators to identify defects early. Do not increase speed, bypass guards or reduce required maintenance simply to improve a spreadsheet. A faster mode that produces rejected output can reduce effective capacity.
Heavy rolls, solvent inks, electrical systems and finishing equipment require appropriate safety controls. Obtain model-specific instructions and safety data sheets, and have qualified professionals assess ventilation, electrical supply, fire precautions and handling under applicable local rules. Production targets should not override safe operation.
Questions to ask a supplier
- What are the exact conditions behind each advertised speed?
- Can you demonstrate our artwork and media at an acceptable quality mode?
- What are the actual printable width, roll weight and take-up limits?
- Which setup, cleaning and maintenance activities are required for the model?
- How are profiles and finishing requirements accounted for in the proposed workflow?
- What training, service and spare-parts support are available?
For machine buying and width, see our 16 ft flex printer buyer guide. For job planning, see large hoarding print planning and single-piece versus panelled banners.
Conclusion
Use measured quality-mode output, realistic available time and actual acceptance and finishing data to estimate capacity. Keep assumptions and calculation boundaries visible, revisit them as the job mix changes, and distinguish what the system can produce from what customers actually order.
Maintain a useful production log
Use a simple log that operators can complete without interrupting safe work. Record job type, media, print mode, start and finish, setup and interruption time, rejected output and finishing time. Define each field so that two shifts count the same event consistently.
Review the log with operators and finishers before changing targets. If a slow shift involved an unusual material or a customer revision, record that context rather than treating it as the normal rate. Compare several representative runs and retain a range for planning.
When a job misses its deadline, examine the full sequence from approved artwork to dispatch. The cause may be a late proof, unavailable roll, print defect or finishing queue. Assign a corrective action to the responsible step and measure whether it improves accepted output.
Frequently Asked Questions
How do I estimate a 16 ft flex printer’s capacity?
Measure representative output at the quality mode you intend to sell, calculate available printing time, account for rejects and compare with finishing capacity. Record all assumptions and update them using actual job data.
Is advertised square feet per hour the same as finished output?
No. Advertised speed may exclude setup, quality loss, trimming, joining and packing. Confirm the test conditions and measure the complete workflow.
What is the difference between capacity and utilisation?
Capacity is the amount a system can produce under stated conditions. Utilisation is the portion actually used; it depends on orders, staff, materials and scheduling.
How do I avoid double-counting setup time?
Define the measurement boundary. If setup is included in the measured end-to-end rate, do not subtract the same setup time again when calculating shift output.
Can finishing limit output even when the printer is available?
Yes. If finishing can complete fewer comparable jobs than the printer produces in the same period, the finishing step can become the bottleneck.
Does a higher pass count always improve business capacity?
Not necessarily. Print mode affects quality and speed, and the correct choice depends on the customer requirement and actual test. Use a mode that produces acceptable work.
Does estimated monthly capacity equal monthly sales?
No. Capacity is a production estimate, while sales depend on customer demand, pricing and delivery. Do not treat a hypothetical capacity calculation as guaranteed revenue or profit.
